
4-hour timeframe
Technical data:
The upper linear regression channel: direction – down.
The lower linear regression channel: direction – sideways.
The moving average (20; smoothed) – down.
CCI: -77.9141
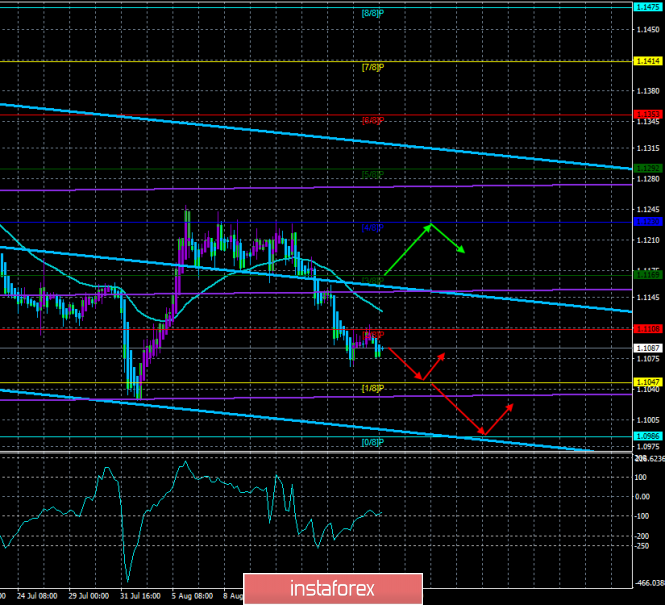
On August 20, the EUR/USD currency pair completed a round of upward correction near the Murray level of "2/8" - 1.1108, from which it rebounded. Now, the euro/dollar pair is waiting for a new decline, which fundamental data will not be able to prevent since the calendar of macroeconomic events of the US and the European Union is empty for the next two days. Yesterday's report on inflation in the European Union confirmed only what most traders already knew and understood. Macroeconomic "figures" of the European Union continue to fall amid the global recession and trade wars. In July, inflation was only 1.0% and continued its slowdown. Based on this, the chances of easing the monetary policy of the European Central Bank at the next meeting are significantly increased, since the regulator simply does not have anything else. Mario Draghi left to finalize in his post only a few months, but these months can be very "fun". And Christine Lagarde will have to plunge headlong into the ultra-soft monetary policy of the ECB from November 1, 2019. By the way, we would like to note that Donald Trump has not yet launched a trade war against the European Union. A few months ago, the US leader wanted to introduce duties on the products of the EU engineering industry but postponed his decision for six months. What will happen if closer to the New Year, the odious US President still begins to put pressure on the European Union? EU industrial production is already declining, and the index of business activity in the manufacturing sector is almost zero. Thus, the current "bad" economic situation in the European Union is still flowers in comparison with what may be in the coming months/years. That is why the long-term outlook of the European currency looks doubtful now. In order for traders to change their mood, global changes are needed, for example, the total reduction of the Fed's key rate by 1.0% - 1.5%. Or the final end of trade wars. First – it is unlikely to happen in the near future. The second – it can be decided by the election of a new US president in 2020. Thus, until the end of 2019, we do not expect a change in the global trend, if the fundamental background does not change abruptly and unexpectedly.
Nearest support levels:
S1 – 1.1047
S2 – 1.0986
S3 – 1.0925
Nearest resistance levels:
R1 – 1.1108
R2 – 1.1169
R3 – 1.1230
Trading recommendations:
The euro/dollar pair completed the correction round very quickly. Thus, it is recommended to sell the pair again with the targets of 1.1047 and 1.0986 until the next turn of the Heiken Ashi indicator upwards. In general, short positions can also be held as long as the price is below the moving average. The long positions are still risky now.
In addition to the technical picture, you should also take into account the fundamental data and the time of their release.
Explanation of illustrations:
The upper linear regression channel – the blue line of the unidirectional movement.
The lower linear regression channel – the purple line of the unidirectional movement.
CCI – the blue line in the indicator window.
The moving average (20; smoothed) – blue line on the price chart.
Murray levels – multi-colored horizontal stripes.
Haiken Ashi is an indicator that colors bars in blue or purple.
The material has been provided by InstaForex Company - www.instaforex.com