
On Wednesday, the pair began to move down after being pushed off the resistance line last Tuesday. Moving down, the pair tested a strong pullback level of 50.0% - 1.2163 (blue dotted line), but could not break it down. Strong calendar news is expected at 12.30 Universal time and 14.00 Universal time (dollar).
Trend analysis (Fig. 1).
On Thursday, the price may continue to move down, with the target of 1.2156 - the lower fractal. In case of breaking through this level, going further down to the pullback level of 61.8% - 1.2127 (blue dashed line) is possible.
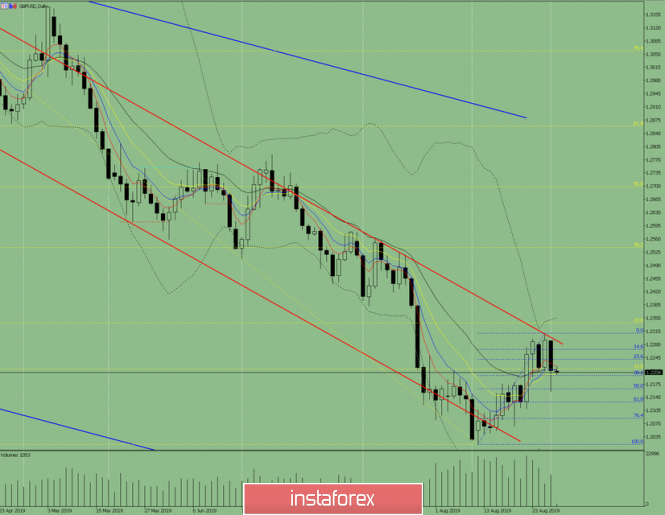
Fig. 1 (daily chart).
Comprehensive analysis:
- indicator analysis - down;
- Fibonacci levels - down;
- volumes - down;
- candlestick analysis - down;
- trend analysis - down;
- Bollinger Lines - down;
- weekly schedule - down.
General conclusion:
On Thursday, the price may continue to move down.
An unlikely scenario is an upward movement to the resistance line 1.2288 (red bold line).
The material has been provided by InstaForex Company - www.instaforex.com