
Gold price has made an important low at $1,266 on May 21st and since then it shows that bulls could make a comeback. Price remains below the key resistance area of $1,295-$1,300 and as long as we trade below that level, bears will be expecting a move lower to $1,250-20 area. Breaking above this area opens the way for $1,350 and higher.
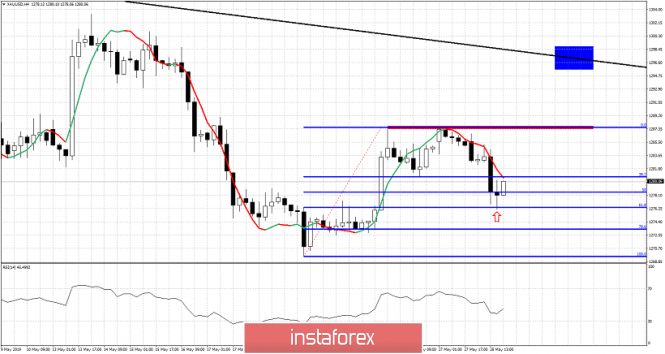
Red rectangle - important short-term resistance
Blue rectangle - target if price breaks above short-term resistance
Black line - major resistance trend line
Gold price has pulled back from $1,288 to $1,270 and the 61.8% Fibonacci retracement level of the latest rise. Gold price has stopped the decline and shows bullish signs. Short-term resistance is at $1,288 and breaking above it will open the way for a move towards the major resistance trend line at $1,296-$1,300. Failure to hold above $1,270-66 would be a bearish sign and will open the way for a move towards $1,250-20.
The material has been provided by InstaForex Company - www.instaforex.com