
Gold price as expected since $1,270 has bounced for a back test of the major support area of $1,280-90. Now there are a lot of chances that the entire back test is over as bulls remain too weak to break above $1,290-$1,300. The next leg down should follow soon.
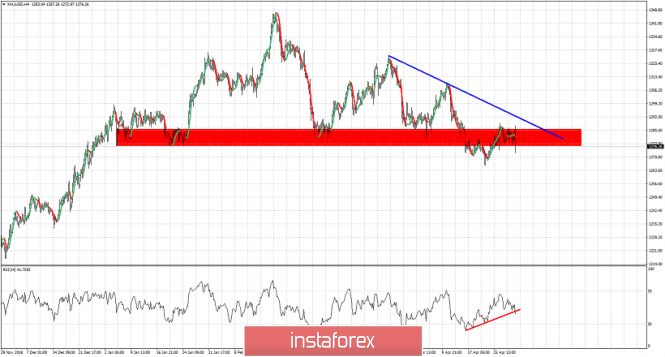
Red line -RSI support trend line
Red rectangle - major confluence area of resistance (previous support)
Gold price remains below the blue trend line resistance and shows rejection signs once again at the red rectangle area that is now resistance and was once support. Inability by the bulls to recapture the $1,280-90 level is a bearish sign. Since this support area was broken we said that we expect prices to move lower towards $1,250-60. Price fell as low as $1,266 and we said expect a back test and then maybe another move lower. As long as price is below $1,300 we continue to expect prices to move lower towards $1,250-60 or even lower. Any bounce is considered a selling opportunity. Gold should see $1,250-60 if price breaks below $1,270.
The material has been provided by InstaForex Company - www.instaforex.com