
Two weeks ago, the dollar/yen pair occupied a price level of 111.70-112.10, after which the daily price chart started to resemble a flat line. Despite the phlegmatic price fluctuations, the USD/JPY actually stands still in anticipation of a powerful information.
Traders even ignored the general strengthening of the dollar in the market, although in the other dollar pairs the greenback significantly strengthened their positions. Such stress tolerance is explained by a contradictory fundamental background. On the one hand, the demand for the yen was not reduced due to the increase in tensions around Iran - the Japanese currency still enjoys the status of a defensive asset. On the other hand, the growth of Chinese indicators, as well as progress in the US-China trade negotiations, remain interested in risk. Although the political conflict between Tehran and Washington can be developed, the market believes in the power of diplomacy. In 2013, Iran already threatened to block the Strait of Hormuz, but then it did not realize its intentions. In addition, the yen's growth is constrained by the activity of carry-traders, although this factor is more likely due to the "thin" post-holiday market.

In other words, the current system of checks and balances have so far allowed traders of the USD/JPY pair to trade in a narrow range flat for two weeks, ignoring the sharp increase in the dollar index. But tomorrow's event may break this idle: we will find out the results of the April meeting of the Bank of Japan.
According to the general opinion of experts, following a two-day meeting, the Japanese regulator will leave the parameters of monetary policy in its previous form. However, it is impossible to talk about this with 100 percent certainty after the events of three years ago. The Bank of Japan unexpectedly, without any warnings and "preludes", lowered the interest rate to a negative area. The piquancy of the situation was added by the fact that a few days before the central bank members' meeting, Haruhiko Kuroda assured the market that there was no intention to soften the conditions of monetary policy. Although since then the Japanese regulator has not presented similar surprises anymore, the "sediment has remained". And with the latest disappointing releases, the risk of making unexpected decisions increases in many ways.
So, lately, Kuroda has increasingly mentioned that the regulator can take "further steps" to achieve the target level of inflation. This means that the Bank of Japan can expand the incentive program and lower the rate again. Let me remind you that the March consumer price index was at the forecast level, that is, at around 0.5%. On the one hand, this is a fairly good result, since from December to February this indicator was at the level of 0.2%. On the other hand, the growth rates are not impressive: for example, last year the indicator fluctuated around 1.3-1.4%. Core inflation reached the level of 0.8% with the forecast of growth to 0.7%. Since December last year, this indicator has been fluctuating in the range of 0.7% -0.8%, therefore, it is possible to speak of a "positive trend" here quite arbitrarily. Moreover, the consumer price index, excluding prices for food and energy, has shown stagnation - for the past three months, the indicator has reached 0.4%.

Such figures obviously do not contribute to the tightening of the rhetoric of the Japanese central bank. However, weak inflation is not the only problem of the Japanese economy. The remaining releases are also disappointing. In particular, industrial output fell to 0.7% (with a growth forecast of 1.4%), household spending fell to -2% (with a decline forecast to -0.5%), and business confidence index fell to 40%. , 5 points. All this suggests that Japan's GDP growth rate in the first quarter will disappoint: at least, many experts are already warning about it.
Despite this "bunch" of negativity, the Bank of Japan is unlikely to change the parameters of monetary policy tomorrow, although Haruhiko Kuroda recently made the probability of lowering the interest rate further into a negative area. He did not specify the temporary guidelines, but warned that such a scenario is quite likely. In my opinion, tomorrow the head of the central bank will again announce this thesis, thereby putting pressure on the yen. In addition, the Japanese regulator may reduce its own forecast for the growth of key indicators (primarily, we are talking about GDP and inflation).
Thus, the results of the April meeting of the Bank of Japan are unlikely to please bears of the USD/JPY pair. There were no reasons for optimism: moreover, the latest macroeconomic releases help to soften the position of the central bank in general and Kuroda in particular.
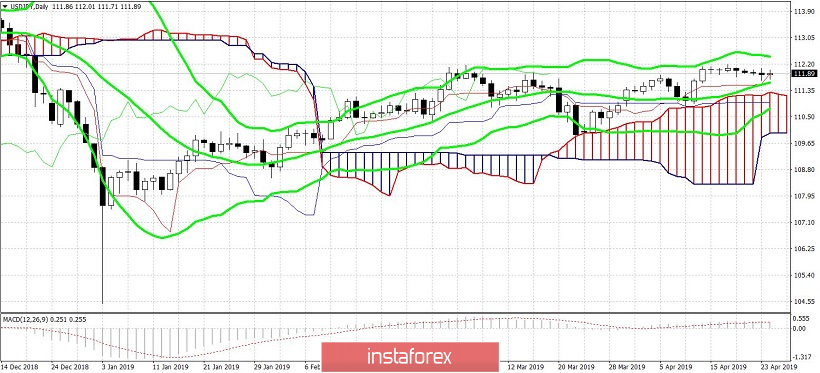
The technical picture of USD/JPY also speaks in favor of the upward movement. On the daily chart, it is located above the Kumo cloud of the Ichimoku Kinko Hyo indicator and above all its lines. A bullish "Parade of ines" signal indicates the potential for further price growth. In addition, the pair is located between the middle and upper lines of the Bollinger Bands indicator. This also indicates bullish sentiment among traders. The nearest target of the upward movement can still be considered the level of 112.60 - this is the resistance level and the upper line of the Bollinger Bands indicator on the D1 timeframe. Stop-loss can be placed in the support level area - this is the middle line of the Bollinger Bands indicator, which corresponds to the mark of 111.70.
The material has been provided by InstaForex Company - www.instaforex.com