
Technical outlook:
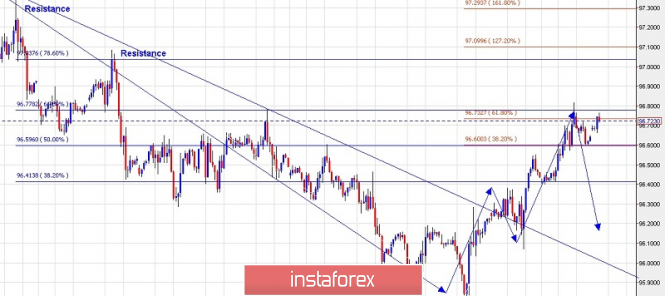
An hour chart for US Dollar Index has been presented here since the 15th of February highs at 97.30/40 levels, until today; to have a short-term chart confirmation of a potential top and reversal ahead. It is quite evident looking into the wave counts that the US Dollar Index had dropped as an impulse wave between 97.30/40 and 95.80 levels respectively. What followed after that has been a corrective, 3-wave rally until now which is seen to have stalled around 96.80 levels yesterday. Please also note that a fibonacci convergence is also seen around 96,80 levels and hence the potential for a bearish reversal remains high. The US Dollar Index is seen to be trading around 96.73 levels at this point of writing with price resistance seen around 97.00 levels. Please note that prices may test up to 97.00 levels but should ideally remain below 97.30/40 mark.
Trading plan:
Remain short with stop above 97.30/40, target is open.
Good luck!
The material has been provided by InstaForex Company - www.instaforex.com