
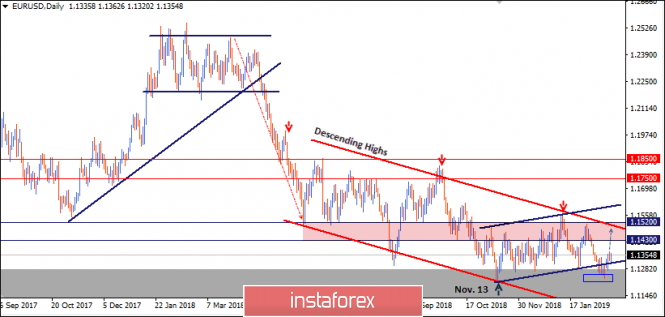
Since June 2018, the EUR/USD pair has been moving sideways with slight bearish tendency within the depicted bearish Channel (In RED).
On November 13, the EUR/USD pair demonstrated recent bullish recovery around 1.1220-1.1250 where the current bullish movement above the depicted short-term bullish channel (In BLUE) was initiated.
Bullish fixation above 1.1430 was needed to enhance a further bullish movement towards 1.1520. However, the market has been demonstrating obvious bearish rejection around 1.1430 few times so far.
The EUR/USD pair has lost its bullish momentum since January 31 when a bearish engulfing candlestick was demonstrated around 1.1514 where another descending high was established then.
On February 5, a bearish daily candlestick closure below 1.1420 terminated the recent bullish recovery.
This allowed the current bearish movement to occur towards 1.1300-1.1270 where the lower limit of the depicted DAILY channel came to meet the pair.
The EUR/USD pair is demonstrating weak bullish recovery around the depicted price zone (1.1300-1.1270) with early signs of bearish reversal probability (Yesterday's bearish hammer daily candlestick).
A bearish flag pattern may become confirmed if bearish persistence below 1.1250 is achieved on the daily-chart basis. Pattern target is projected towards 1.1000.
Trade Recommendations:
A counter-trend BUY entry was already suggested near the price level (1.1285) (the lower limit of the depicted movement channel). T/P level to be located around 1.1350 and 1.1420 while S/L should be advanced to entry level.
The material has been provided by InstaForex Company - www.instaforex.com