
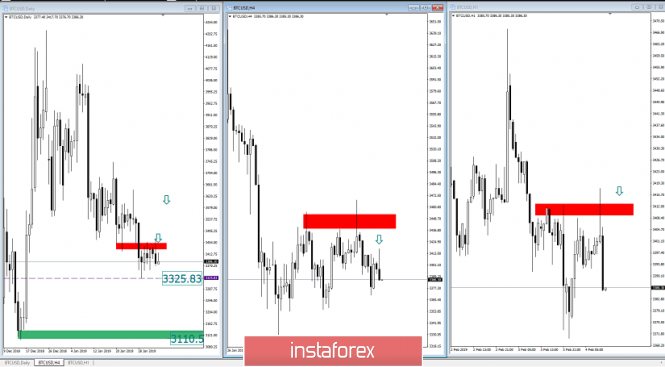
Bitcoin has been trading sideways at around $3,389. The overall short-mid-long term trend is bearish and you should watch for selling opportunities. Using the multi – time frame analysis I found the key resistance to be at $3.460.
Daily time frame: On the daily time-frame we found that the swing low at $3.460 in the background, now became key resistance and the price doesn't have power to break it.
H4 time - frame: I found a successful test of the high at $3.455 (red rectangle), which confirmed resistance.
H1 time – frame: Strong pin-bar in the background just after the test of the resistance (red rectangle), which is a sign that aggressive sellers are present.
R1: $3.462
R2: $3.509
R3: $3.546
Pivot: $3.424
S1: $3.377
S2: $3.339
S3: $3.293
Trading recommendation: We are short BTC/USD from $3,392 and with the target at $3,110. Protective stop is moved at $3.470.
The material has been provided by InstaForex Company - www.instaforex.com