
Technical outlook:
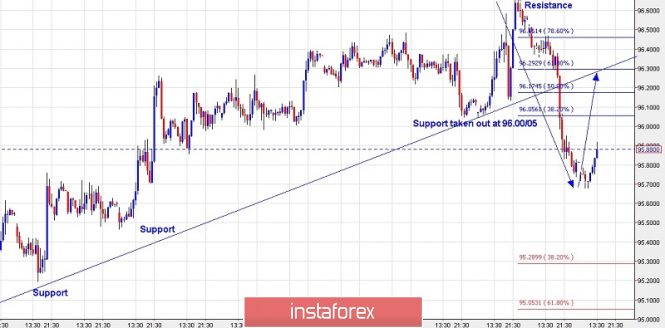
We have presented an hourly chart view for US Dollar Index today, for the most probable move in next 1-2 trading sessions. As seen above, the US Dollar Index has finally managed to break its immediate support trend line and is now seen to be trading into the sell zone. Furthermore, the price support at 96.00/05 has been broken as well, indicating that a potential bearish resumption could be underway. Please note that 96.68 levels could prove as strong resistance and a meaningful top in place for the next several trading sessions. Any intraday rallies could test the back side of support turned resistance trend line and reverse lower, from a fibonacci level as depicted here. The fibonacci 0.818 resistance is seen at 96.29 levels, along with the backside of trend line resistance and a bearish reaction there could resume the down trend. Any intraday rallies should be now taken as opportunities to initiate fresh or add more short positions.
Trading plan:
Remain short for now, stop at 96.70, target 94.00 levels at least.
Good luck!
The material has been provided by InstaForex Company - www.instaforex.com