MG Network

something big isHappening!

In the mean time you can connect with us with via:

Copyright © Money Grows Network | Theme By Gooyaabi Templates

Money Grows Network

Archive

Powered by Blogger.

Welcome To Money Grows Network

Verified By

2006 - 2019 © www.moneygrows.net

Investments in financial products are subject to market risk. Some financial products, such as currency exchange, are highly speculative and any investment should only be done with risk capital. Prices rise and fall and past performance is no assurance of future performance. This website is an information site only.

Popular

Pages

Expert In

Name*


Message*

Technical analysis for Gold for January 28, 2019

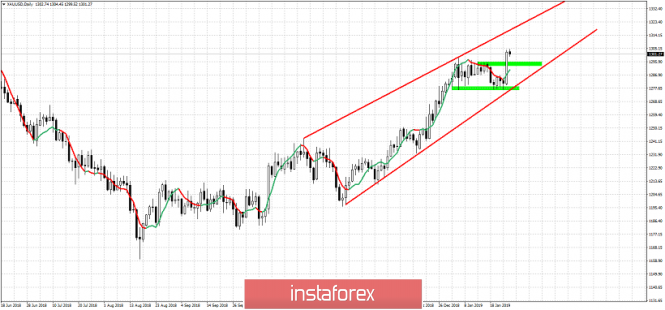
Gold price broke above $1,292 resistance we mentioned in our previous posts and this was a bullish signal. Gold price is now trading above $1,300 and could continue higher towards $1,315-20 which is our next target.

analytics5c4ee4845c9d8.png

Green rectangles - support areas

Red lines - bullish channel

Gold price remains in a bullish trend. We noted that only a break below $1,276 would open the way for a move towards $1,260. A break above $1,292 signaled that a bullish move was starting. Gold price remains in a bullish trend as long as price remains above $1.277. Short-term support is found at $1,292-95 and resistance at $1,315. Breaking below the lower red upward sloping trend line would be a bearish sign.

The material has been provided by InstaForex Company - www.instaforex.com