
Today we take a look at the weekly chart in Gold since 2007. Gold is in a short-term bullish trend and we talked about short-term targets of $1,310-20 and the possibility that this up trend could continue towards its major long-term resistance area of $1,350-60. But what should we expect if this level is broken?
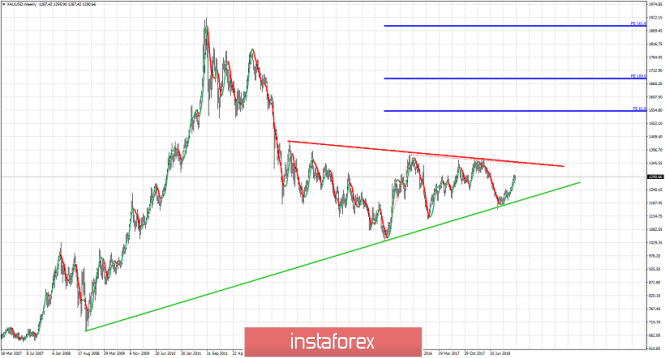
Red line - major trend line resistance
Gold price has respected the green trend line support and bounced off of it and is now heading towards the red trend line resistance found around $1,350. A break above this area will lead to a move towards $1,550-$1,660. However I believe it is more probable to see an initial rejection and pull back at the $1,350 resistance area, before making a break out. Of course this bullish scenario gets cancelled if price breaks below the green trend line support. Then we will be talking for a move below $1,000 towards $700-800 or lower.
The material has been provided by InstaForex Company - www.instaforex.com