
Technical outlook:
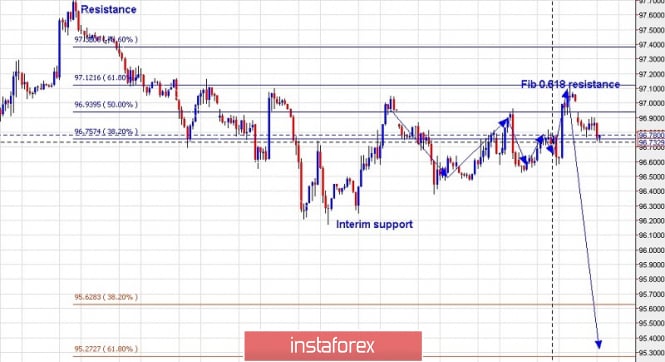
An hourly chart has been again depicted here for short-term trading setups. The US Dollar Index reached the 97.10 levels as discussed yesterday, before reversing lower again. The index is currently trading at the 96.80 levels and then it is expected to push lower towards the 95.20 levels. Please note that 97.10 is the Fibonacci 0.618 resistance as depicted on the chart, hence it is quite possible that a meaningful top is located place there. Ideally, bears are expected to remain in control from here with resistance and interim support at the levels of 97.71 and 96.20, respectively. Also pay attention that the minimum expected price rise after breaking out of consolidation is now complete at the 97.10 levels. The short-term trend setup will probably to be on the southern side till the prices stay below the 97.71 levels.
Trading plan:
Sell from 97.10 with a stop loss order at 97.71 and the target of at least 95.00.
Good luck!
The material has been provided by InstaForex Company - www.instaforex.com