
Gold remains in the bullish trend making higher highs and higher lows. Yesterday, the price made a pullback towards $1,264. In our last analysis, we noted that as long as the price is above the $1,245-50 area, trend remains bullish at least in the short term.
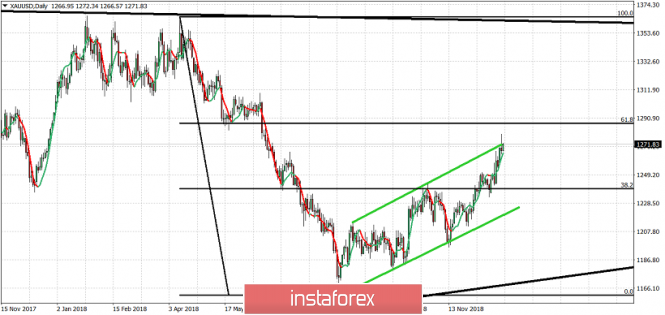
Gold price got rejected at the upper channel border and pulled back from $1,279 to $1,264. Gold price got very close to the 61.8% Fibonacci retracement level which was our next target. There is no warning from the RSI yet neither in the daily chart or the H4 chart. Short-term support is found at yesterday's lows and the next one is at $1,255. I believe that a new higher maximum may come and push the price closer to the 61.8% Fibonacci retracement.
The material has been provided by InstaForex Company - www.instaforex.com