
Large scale graphics:
As part of the rising wave dominating from March on the yen chart in recent months, a hidden correction is being formed. It has a complex irregular shape and is close to completion.
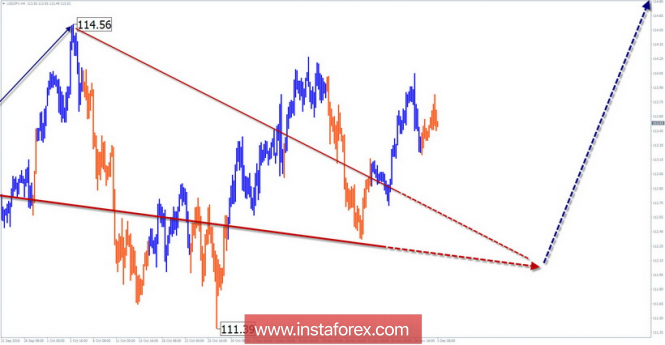
Medium scale graphics:
From the beginning of October, the price in the lateral plane forms a bearish wave zigzag. It completes a larger correction wave.
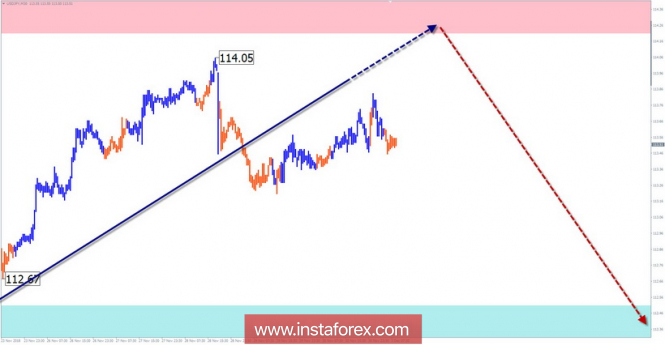
Small scale graphics:
From November 12, the downward wave is formed. At the time of analysis, the middle part (B) is nearing its completion. The wave is at the end of a larger wave structure.
Forecast and recommendations:
This week the flat correctional price movement will continue. The volatility of the pair may increase. Sales are possible as part of intraday transactions, but it is wiser to reduce the lot. For a full trade, you need to wait for the completion of the entire wave of correction.
Resistance zones:
- 114.20 / 114.70
Support areas:
- 112.50 / 112.00
Explanations to the figures: The simplified wave analysis uses waves consisting of 3 parts (A - B - C). For analysis, 3 consecutive graphs are used. Each of them analyzes the last, incomplete wave. Zones show calculated areas with the highest probability of reversal. The arrows indicate the wave marking by the method used by the author. The solid background shows the formed structure, the dotted - the expected movement.
Attention: The wave algorithm does not take into account the duration of tool movements over time. To conduct a trade transaction, you need confirmation signals from the trading systems you use.
The material has been provided by InstaForex Company - www.instaforex.com