
On the weekly chart, the price moved up and tested the retracement level of 1.485 (blue dotted line) and went down. A significant role in this was played by fundamental analysis. In the coming week, moving down after a re-test of the support line at 1.1297 (white thin line), it is possible to move upward with the first target at 1.1485 – a pullback level of 14.6% (blue dotted line). Breaking through the support line is unlikely. Candlestick analysis gives the upper hand, and the volumes also do not agree with the bottom. Along with the support line, there is also the lower fractal of 1.1302. This combination usually rarely makes its way down from the first time. It remains to see what the indicator analysis will say.
Trend analysis (Fig. 1).
In the coming week, the price can once again test the support line of 1.1297 (white thin line) and only after that go up with the first target at 1.1485 – a pullback level of 14.6% (blue dotted line). Breaking the support line down is unlikely.
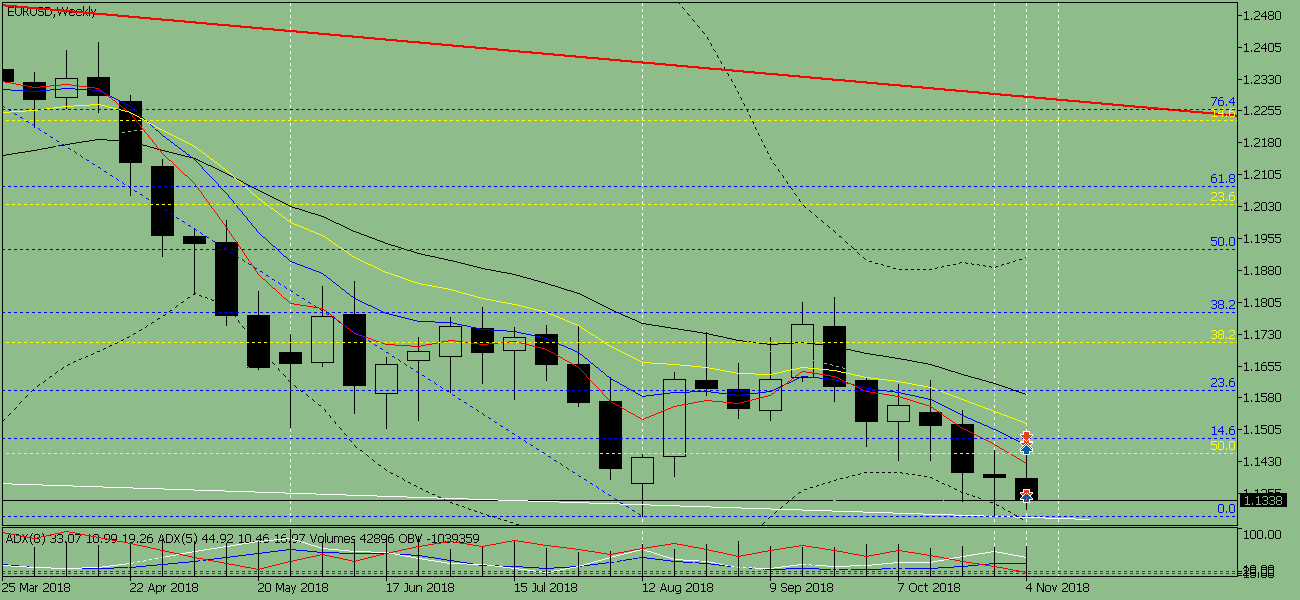
Fig. 2 (weekly chart).
Complex analysis:
- indicator analysis - up;
- Fibonacci levels - up (blue dotted line);
- volumes - down;
- candle analysis - up;
- trend analysis - up;
- Bollinger bands - up;
- monthly chart - up.
Conclusion on complex analysis - up.
Calculation of the first shadow of the week (Monday) on the weekly chart.
The middle line EMA 1/5/8 – bottom signal.
The "three lines" indicator (direction of lines of indicators CCI(5), RSI (5), stochastic with a period of 3/3/4) on the last run – down.
Calculation of the RSI indicator system for the first tail – down.
The result: the calculation of the weekly candlestick according to the indicator analysis showed that on Monday the price may have a downward trend, which should be confirmed by the daily chart.
Calculation of the second shadow of the week (Friday).
Calculation by MACD linear part - gave a downward trend (100 points down).
Calculation of the MACD histogram - gave a downward trend (100 points down).
The bottom line: the calculation of the last day of the week according to technical analysis showed that on Friday the price may have a downward trend, which should be confirmed by the daily chart.
The overall result of the calculation of the candles of the EUR/USD currency pair on the weekly chart: the price of the week is likely to have an upward trend with the presence of the first lower shadow of the weekly white candle (Monday – down) and the presence of the second upper shadow (Friday – down).
In the coming week, after repeated testing of the support line 1.1297 (white thin line), an upward movement with the first target 1.1485 is possible – a pullback level of 14.6% (blue dotted line).
The material has been provided by InstaForex Company - www.instaforex.com