
Gold price has broken through all support levels and the bullish scenario for a move towards $1,260 has been canceled. Gold price was very weak and the rejection at $1,240 has cost bulls a lot. Trend is bearish for the short-term again as the sideways range trading has broken to the downside.
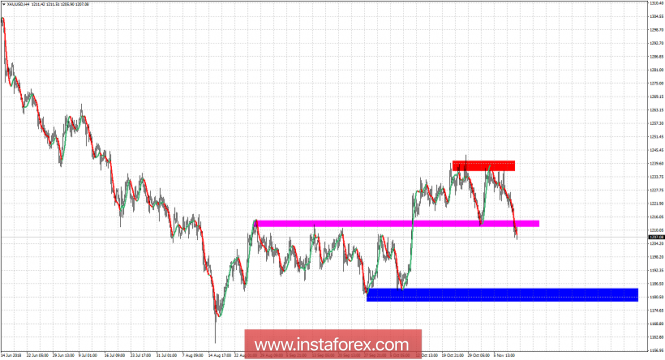
Magenta rectangle- support (broken)
Blue rectangle- next support/target area
Gold price is making new lows. Short-term trend is bearish. Price has broken through the $1,212 support. This implies that any bounce should be seen as a selling opportunity as long as price is below $1,240. As long as we remain below the resistance we should expect Gold price to move towards the blue target area. Short-term resistance levels for Gold are at $1,217 and next at $1,225. Support is at $1,206. So from current levels we could see a bounce in Gold price early this week. If not, then this is another weakness sign.
The material has been provided by InstaForex Company - www.instaforex.com