
Technical outlook:
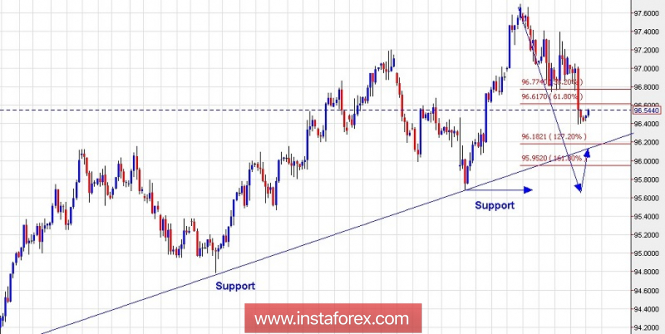
The 4H chart for US Dollar Index has been depicted here for medium-term wave structure. As seen here the index has been bouncing off its trend line support since forming lows at 93.80 levels earlier. It remains to be seen how prices react to trend line support going forward. The US Dollar Index might have formed a meaningful high at 97.70 levels on November 13, 2018, and a break below 95.65/70 levels would confirm. Please note that the above price support at 95.65 levels needs to be broken if bearish momentum has to continue. On the flip side, a bullish reversal from current price action and further push above 97.40 levels would indicate more upside.
Trading plan:
Aggressive traders can go short with stop above 97.70 levels and target open.
Good luck!
The material has been provided by InstaForex Company - www.instaforex.com