
To open long positions on GBP / USD you need:
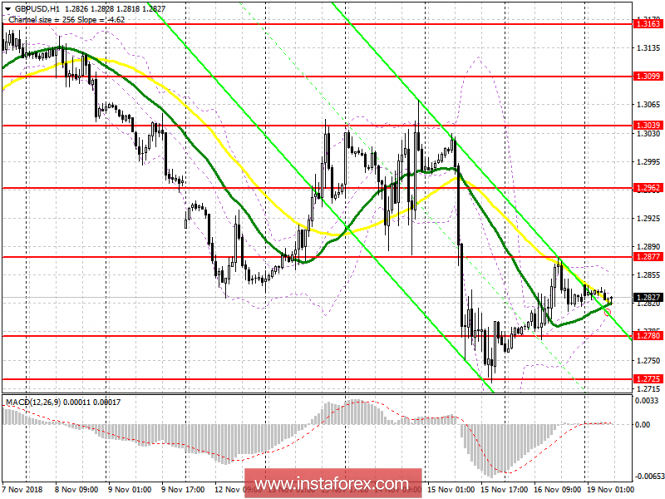
Volatility gradually stabilizes and buyers return to the market. The news that Steven Barkley will become the new Brexit minister in the UK has also strengthened the position of buyers. At the moment, the main task is to break through the upper boundary of the channel in the 1.2877 area, which will lead to the formation of a new upward wave with access to the highs in the 1.2962 and 1.3040 areas, where I recommend taking profits. In the case of a decrease in the pound, support will be at the level of 1.2780. However, it is possible to rebound immediately from the low of 1.2725.
To open short positions on GBP / USD you need:
An unsuccessful consolidation above resistance 1.2877 will be a signal to open short positions in order to reduce to the area of first support 1.2780. The breakdown of which will lead to a larger sale of GBP / USD with a test of 1.2725 minimum, where I recommend to take profits. In the case of positive news on Brexit, a break of 1.2877 will lead to an increase in the pound. In such a scenario, it is best to open short positions to rebound from the highs of 1.2962 and 1.3039.
Indicator signals:
Moving averages
Trade is conducted in the area of 30- and 50-day moving averages, which indicates the formation of the lateral nature of the market.
Bollinger bands
The Bollinger Bands indicator indicates a decrease in volatility and does not give signals on market entry.
Description of indicators
- MA (moving average) 50 days - yellow
- MA (moving average) 30 days - green
- MACD: fast EMA 12, slow EMA 26, SMA 9
- Bollinger Bands 20