
Gold price pulled back towards the 38% Fibonacci retracement as expected. Gold price could be making a higher low now before the next leg up towards $1,260. Short-term trend remains bullish as long as we trade above $1,212.
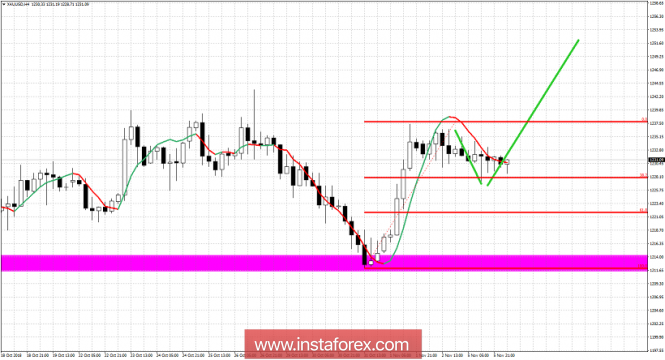
Magenta - rectangle - major support area
Green lines - expected path
So far Gold price is following our expected path by pulling back. Support is at $1,228 and next at $1,222 where we find the 61.8% Fibonacci retracement. As long as we trade below $1,236.50 there are still chances of visiting the 61.8% support area. If we break above $1,236.50 we should be heading above $1,240-45 area. I continue to favor the bullish scenario but we will soon need to see more signs of strength. Breaking above $1,235-40 area would be a very bullish sign for Gold.
The material has been provided by InstaForex Company - www.instaforex.com