
To open long positions on EUR / USD, you need:
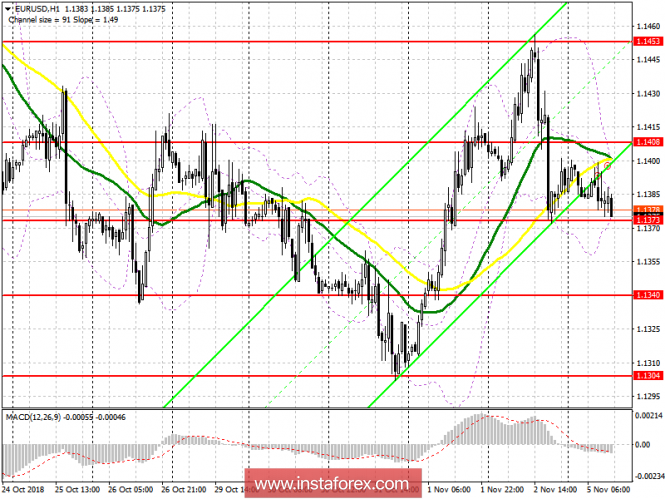
Buyers failed to get out of the resistance range of 1.1408 in the first half of the day, and it seems that they are about to give up support 1.1373. Only the formation of a false breakdown at this level will be a signal to buy euros. The main goal remains the breakthrough and consolidation above the resistance of 1.1408, which will lead to another wave of growth of EUR / USD with access to the highs of 1.1453 and 1.1516, where I recommend fixing the profits. In the event of a decline in the euro below the level of 1.1373, it is best to return to long positions to rebound from a minimum of 1.1340.
To open short positions on EUR / USD you need:
Breakthrough and consolidation below the important support level of 1.1373 will help to resume the downward trend in the euro and break through the lower limit of the upward channel, which will lead to the updating of last week's lows around 1.1340 and 1.1304, where I recommend fixing profits. If the euro rises above the resistance level of 1.1408 in the second half of the day, sales can be returned to rebound from 1.1453.
Indicator signals:
Moving Averages
Trade is conducted below the 30- and 50-day average, which indicates an attempt by bears to return to the market.
Bollinger bands
The lower limit of the Bollinger Bands indicator coincides with the support around 1.1373, and its breakdown will be an additional signal for opening short positions in the euro.
Description of indicators
- MA (moving average) 50 days - yellow
- MA (moving average) 30 days - green
- MACD: fast EMA 12, slow EMA 26, SMA 9
- Bollinger Bands 20