
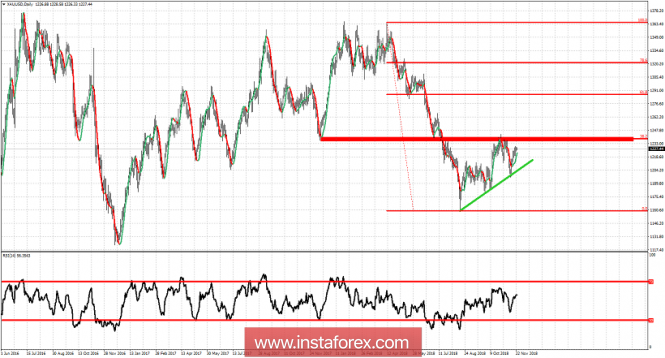
Gold price remains below the important long-term resistance of $1,240-43.50. On a daily basis, price is making higher highs and higher lows for the last 3 months. If we see higher highs in November then we could expect much more upside in Gold prices. If the recent lows are broken, Gold will most probably push to new lows over the coming months.
Red rectangle - long-term resistance
Gold price has so far peaked at the 38% Fibonacci retracement level and where we also find important previous lows which are now confirmed resistance. Gold bulls need to break above $1,240 major resistance and the road to $1,270-$1,300 will be open. On the contrary, bears need to break below the green trend line support and specially below $1,180. If this happens, we should expect Gold prices to move below $1,100 over the coming months.
The material has been provided by InstaForex Company - www.instaforex.com