
To open long positions for EURUSD, it is required:
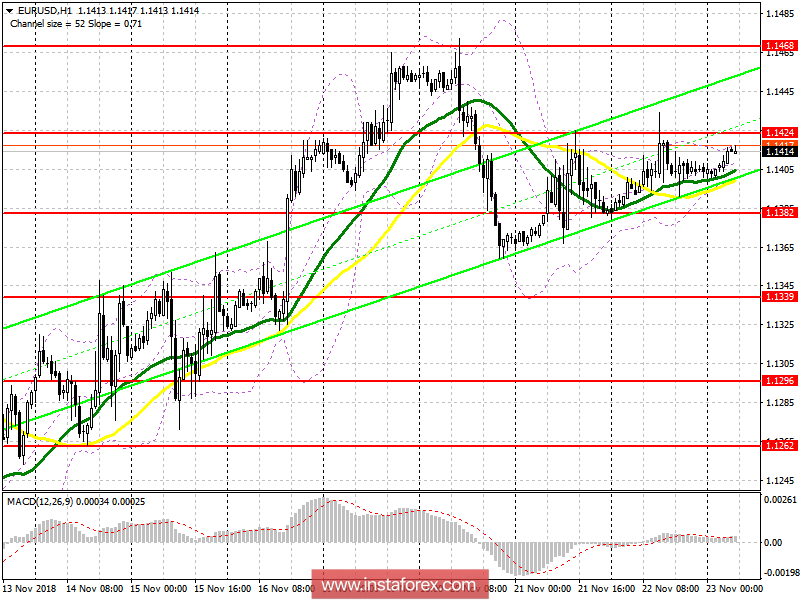
As long as trade is conducted above the support level of 1.1382, the demand for the euro will remain. The formation of a false breakdown in this area will lead to an increase in the EUR/USD, and the main task will be a breakthrough and consolidation above the resistance of 1.1424, which will allow us to count on a larger upward trend with an update of the weekly high around 1.1468, where I recommend taking profits. In case the euro declines below the support level of 1.1382, it is best to return to the rebound from the lows of 1.1339 and 1.1296.
To open short positions for EURUSD, it is required:
A break of support at 1.1382 could lead to the formation of a larger downward wave in European currency with a rise to the lows of 1.1339 and 1.1296. In the event of growth during the first half of the day, short positions can be returned when a false breakdown is formed in the resistance area of 1.1424. In a different scenario, it is best to open short positions in the EUR/USD to rebound from a high of 1.1468.
Indicator signals:
Moving averages
Trade is conducted in the area of 30-day and 50-day moving averages, which indicates the formation of a side channel.
Bollinger bands
The volatility of the Bollinger Bands indicator decreases, which does not give clear signals on market entry.
Indicator description
- Moving Average (average sliding) 50 days - yellow
- Moving Average (average sliding) 30 days - green
- MACD: fast EMA 12, slow EMA 26, SMA 9
- Bollinger Bands 20