
Gold price has pulled back below $1,200 again. This is not a good sign for bulls. However there is a chance we see a higher low in Gold. Key resistance remains at $1,211. Bulls need to break this obstacle in order to continue higher. This pull back could very well be a back test of broken channel resistance.
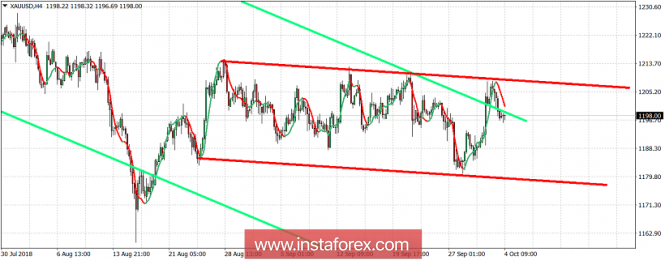
Red lines - trading range
Gold price still inside the trading range trying to break above the green bearish long-term channel. Resistance is at $1,211 and only a break above will change medium-term trend. Support is at $1,190-85. Break below it and we should challenge the lower boundary of the trading range. I believe there are high probabilities of a higher low around $1,198 and then a move higher to break resistance.
The material has been provided by InstaForex Company - www.instaforex.com