MG Network

something big isHappening!

In the mean time you can connect with us with via:

Copyright © Money Grows Network | Theme By Gooyaabi Templates

Money Grows Network

Archive

Powered by Blogger.

Welcome To Money Grows Network

Verified By

2006 - 2019 © www.moneygrows.net

Investments in financial products are subject to market risk. Some financial products, such as currency exchange, are highly speculative and any investment should only be done with risk capital. Prices rise and fall and past performance is no assurance of future performance. This website is an information site only.

Popular

Pages

Expert In

Name*


Message*

Technical analysis of Gold for October 11, 2018

Gold price remains inside the trading range of $1,180-$1,210. Price is trying to make higher highs and higher lows. Bulls could see $1,220-40 area if we break above $1,207-11. Support so far is held but a break below $1,183 would be a bearish sign and could give Gold a push lower by at least 10$.

analytics5bbef2217d563.png

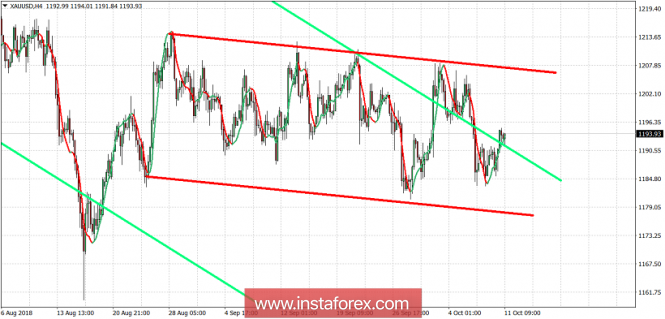
Green lines - long-term bearish channel

Red lines - trading range

Gold price although it is moving out of the long-term bearish channel, will need to break above $1,211 to make a strong bounce higher. As long as price is below $1,211 there is still a danger of pushing to new lows. Support is at $1,183. Resistance is at $1,207 and next at $1,211.

The material has been provided by InstaForex Company - www.instaforex.com