
To open long positions for EURUSD, it is required:
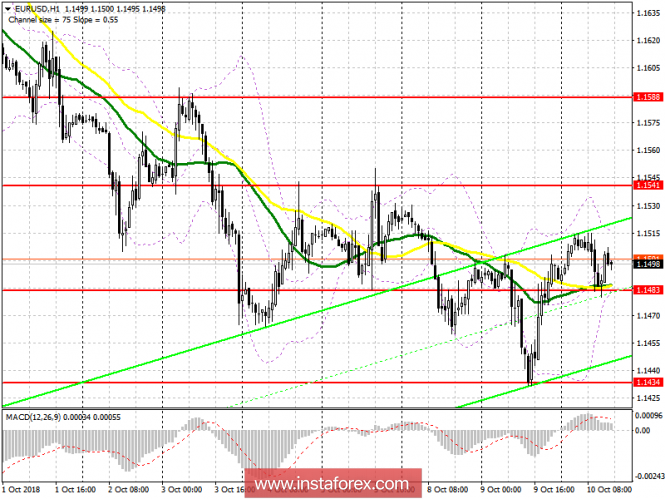
There were no significant changes in the first half of the day. Buyers managed to form a false breakout at the level of 1.1483, which I drew attention to in my morning review, which retained its upward potential in the euro. The main task for the second half of the day will be to update the resistance of 1.1541 and consolidate on it, which will lead to a larger upward momentum for the euro with a test of the highs of 1.1588 and 1.1648, where I recommend locking in profits. In case of a decline below the support level of 1.1483, long positions can be returned only to a rebound from 1.1434.
To open short positions for EURUSD, it is required:
It would be best to expect short positions in the second half of the day after an update of the resistance of 1.1541 with the formation of a false breakdown there. The main task is to reduce and consolidate below the support level of 1.1483, where the 30-day and 50-day average are also located, which will be a clear signal to open new short positions in the euro with an update of the low of 1.1434, where I recommend taking profit. In case of growth above 1.1541, you can immediately sell the EUR/USD on the rebound from the high of 1.1588.
Indicator signals:
Moving averages
The price is above the 30-day and 50-day average, but finding the average at the same level indicates only the sideways nature of the market.
Bollinger Bands
There are no signals to enter the market, since the volatility on the Bollinger Bands indicator has fallen dramatically.
Indicator description
- Moving Average (average sliding) 50 days - yellow
- Moving Average (average sliding) 30 days - green
- MACD: fast EMA 12, slow EMA 26, SMA 9
- Bollinger Bands 20