
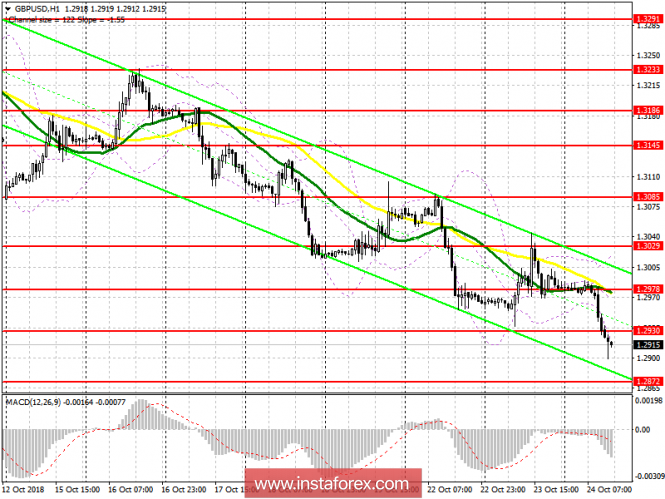
To open long positions on GBP / USD, you need:
The pound continues to fall along the trend amid the lack of good news related to Brexit. At the moment, it is best to return to long positions after breaking through and fixing above the resistance level of 1.2930, which may provoke an upward correction in the area of daily highs to the area of 1.2978, where I recommend fixing the profits. In the event of a further decrease in the pound, you can buy on the rebound from the new monthly minimum in the area of 1.2872.
To open short positions on GBP / USD, you need:
The bears completed the installation in the first half of the day and broke through the support level of 1.2970, which kept the pound from a new wave of decline. At the moment, while trading is conducted below 1.2930, the pressure on GBP / USD will continue, which will lead to a test of the new monthly minimum around 1.2872, where I recommend fixing the profits. An unsuccessful attempt to get above 1.2930 will also be a signal to sell the pound. Otherwise, short positions can be opened for a rebound from the resistance of 1.2978.
Indicator signals:
Moving Averages
Trade is conducted under the 30- and 50-day average, which indicates the formation of a downtrend on the pound.
Bollinger bands
The lower limit of the Bollinger Bands indicator is broken, which indicates a bear market. In the case of an upward correction to sales, you can return with a test of the middle line of the indicator.
Description of indicators
- MA (moving average) 50 days - yellow
- MA (moving average) 30 days - green
- MACD: fast EMA 12, slow EMA 26, SMA 9
- Bollinger Bands 20