
To open long positions on EUR / USD, you need:
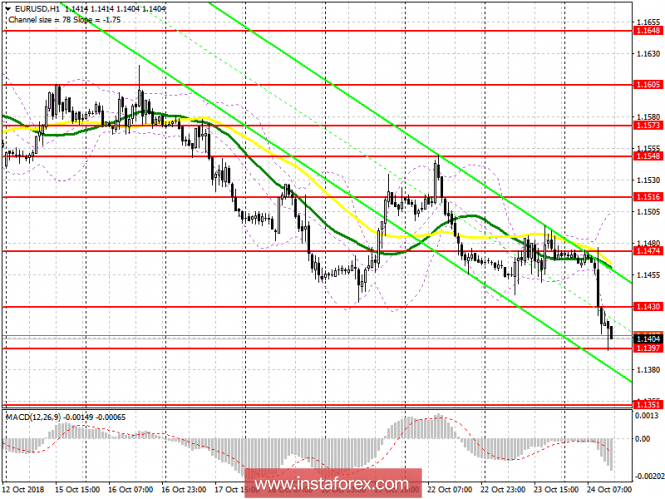
The buyers failed to keep the market above fairly significant support levels, which led to a new wave of decline in the euro. At the moment, the level is supported by 1.1397, but the repeated test will again lead to a decrease in EUR / USD. In this scenario, the long positions are best to return to the rebound from a minimum of 1.1351. The main task of buyers for the second half of the day will be fixing above the resistance level of 1.1430, which will lead to a larger upward correction in the area of 1.1474, where I recommend fixing the profits.
To open short positions on EUR / USD, you need:
The downtrend persists. While the trade is under resistance at 1.1430, the pressure on the euro will be present, and the repeated test of support for 1.1397 may lead to a new wave of sales of EUR / USD with the renewal of lows around 1.1351, where I recommend fixing the profits. In the case of growth above the resistance level of 1.1430 in the second half of the day, it is best to return to short positions in euro to rebound from morning resistance of 1.1474.
Indicator signals:
Moving Averages
Trade is conducted under the 30- and 50-day average, which indicates the formation of a downward trend in the euro.
Bollinger bands
The lower limit of the Bollinger Bands indicator is broken, which indicates the bearish nature of the market. In the case of an upward correction, you can sell the euro on a rebound from the middle border of the indicator, which is currently in the region of 1.1455.
Description of indicators
- MA (moving average) 50 days - yellow
- MA (moving average) 30 days - green
- MACD: fast EMA 12, slow EMA 26, SMA 9
- Bollinger Bands 20