
To open long positions for EURUSD, it is required:
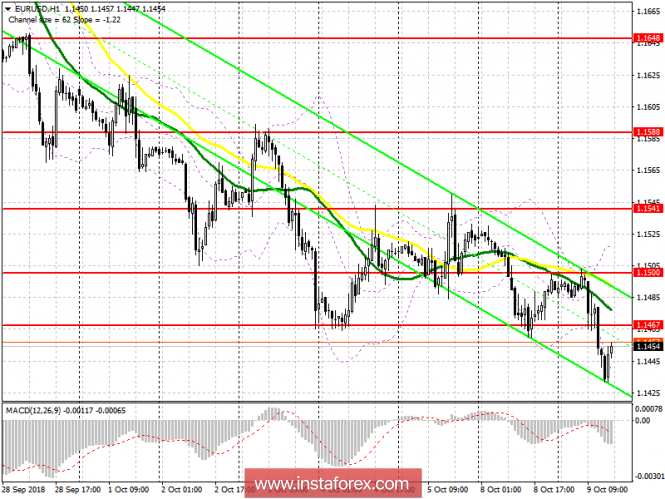
Buyers failed to maintain an important support level of 1.1461, which I drew attention to in my morning review, which led to the continuation of the fall of the European currency. At the moment, the task of buyers of the euro will be the return and consolidation above 1.1467, from where it will be possible to count on a larger upward correction in the area of 1.1500, where I recommend taking profits. In the event of a further decline in the euro, long positions are best returned to a rebound from a low of 1.1399.
To open short positions for EURUSD, it is required:
An unsuccessful attempt to return to the resistance level of 1.1467 will be a direct signal to open new short positions in the euro, based on a decline to the next low in the area of 1.1397 and to update the support of 1.1351, where I recommend taking profits. If the euro rises above 1.1467 in the second half of the day, short positions can be returned immediately to the rebound from the resistance of 1.150.
Indicator signals:
Moving averages
The price is under 30 and 50 average, which indicates a continuation of the downward trend in European currency.
Bollinger bands
The break of the lower border of the Bollinger Bands led to another sale of the euro. The resistance is the middle of the channel 1.1478.
Indicator description
- Moving Average (average sliding) 50 days - yellow
- Moving Average (average sliding) 30 days - green
- MACD: fast EMA 12, slow EMA 26, SMA 9
- Bollinger Bands 20