
To open long positions for EURUSD, it is required:
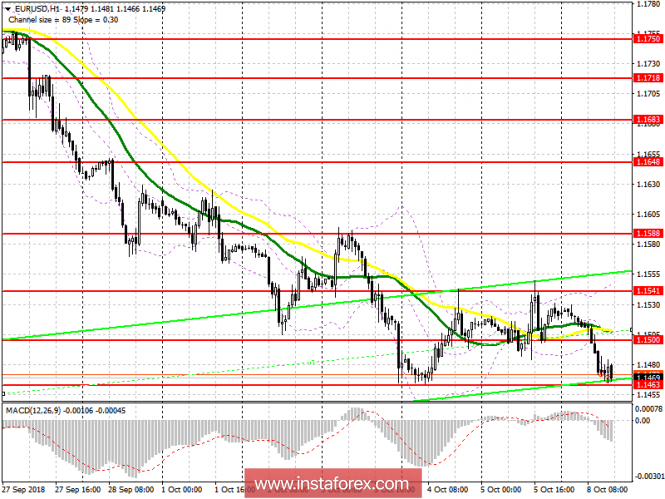
Buyers failed to stay in the mid-channel area of 1.1500, which I paid attention to in my morning review, and now the main level of support is the area of 1.1463. Only the formation of a false breakout on it will lead to an upward correction in the euro, although this is unlikely. In case of a break below 1.1463, it is best to look at long positions only after updating the support for 1.1399 or rebound from the low of 1.1351.
To open short positions for EURUSD, it is required:
The strong fall in the euro in the morning and the test of weekly support levels indicates the preservation of bearish sentiment in the market, which is also fueled by a very strong drop in gold. A breakthrough of 1.1463 will lead to a new downward wave in the euro with a test of lows at 1.1399 and 1.1351, where I recommend to take profit. In case of EUR/USD growth in the second half of the day, short positions can be considered after the formation of a false breakout at 1.1500 or a rebound from 1.1541. We should not forget that today a number of US exchanges are closed due to Columbus Day, which will affect market volatility and volume.
Indicator signals:
Moving averages
The price returned at 30 and 50 average, indicating the resumption of the downward trend in the European currency.
Bollinger Bands
The break of the lower border of the Bollinger Bands around 1.1460 will lead to a new wave of short positions in the euro.
Indicator description
- Moving Average (average sliding) 50 days - yellow
- Moving Average (average sliding) 30 days - green
- MACD: fast EMA 12, slow EMA 26, SMA 9
- Bollinger Bands 20