
To open long positions on EUR / USD, you need:
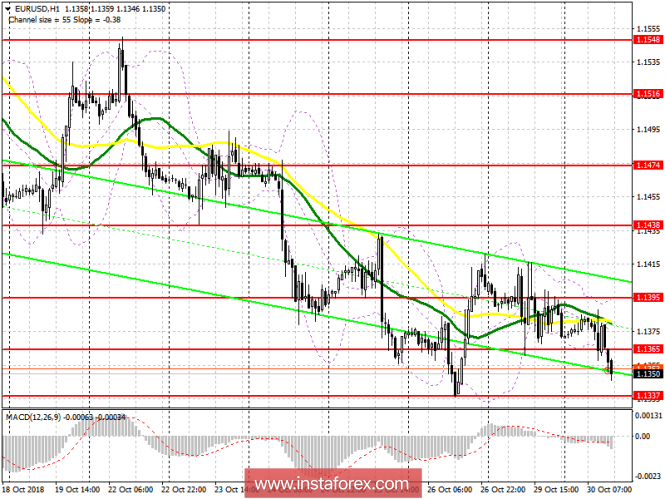
Buyers gave up the morning standoff, which I talked about in detail here. Weak data on the growth of the eurozone economy, released in the morning, put pressure on the euro. At the moment, it is possible to count on long positions in euros after returning and fixing above the resistance level of 1.1365, which will lead to a larger increase in EUR / USD in the area of 1.1395, where I recommend fixing the profits. There is also hope for the level of 1.1337, but there it's best to open long positions after the formation of a false breakdown. The breakthrough of the level of 1.1337 and a further fall will be able to stop only the lows of 1.1300 and 1.1251, from where the euro can be bought immediately for a rebound.
To open short positions on EUR / USD, you need:
The sellers coped with the morning task, and as long as the trade is conducted below the resistance of 1.1365, the pressure on the euro will continue. The main task for the second half of the day is the test and breakdown of the support level of 1.1337, which will lead to the formation of a larger downward wave with access to monthly minimums of 1.1300 and 1.1251, where I recommend fixing the profits. In the case of a return to the resistance level of 1.1365 in the second half of the day, it is best to consider short positions when updating the daily maximum near 1.1395.
Indicator signals:
Moving Averages
Trade has moved below the 30- and 50-day average, indicating a further decline in the euro.
Bollinger bands
The volatility of the Bollinger Bands indicator is rather low, however, a breakthrough of the lower border around 1.1345 could lead to a further sale of the euro.
Description of indicators
- MA (moving average) 50 days - yellow
- MA (moving average) 30 days - green
- MACD: fast EMA 12, slow EMA 26, SMA 9
- Bollinger Bands 20