
To open long positions for GBP/USD, it is required:
Buyers of the pound worked out the support level of 1.3028, which I paid attention to in my morning forecast, and now all the attention is focused on the breakthrough of the resistance of 1.3077, which could not be done even after the Bank of England's statements about the need for further tightening of monetary policy. Apparently, a lack of clarity about Brexit scares off potential buyers of the pound. Only a breakthrough of 1.3077 will lead to a new upward wave in GBP/USD with an exit to the highs of 1.3119 and 1.3165, where I recommend profit taking. In the event of a decline under the support level of 1.3028 in the afternoon, you can return to buying on a test at 1.2981 or a rebound from 1.2937.
To open short positions for GBP/USD, it is required:
The bears managed to keep the pair below the resistance of 1.3077, and now the whole emphasis is shifted to a support of 1.3028, the breakthrough of which will lead to a major sell-off of the pound with an update of the lower border of the side channel at 1.2981, the breakdown of which will call into question the entire upward short-term trend. The consolidation below 1.2981 will push the GBP/USD pair to the lows of 1.2937 and 1.2872, where I recommend to lock in profit. If the pound rises above 1.3077 in the second half of the day, sales can be searched on the resistance test of 1.3119 or on a rebound from 1.3165.
Indicator signals:
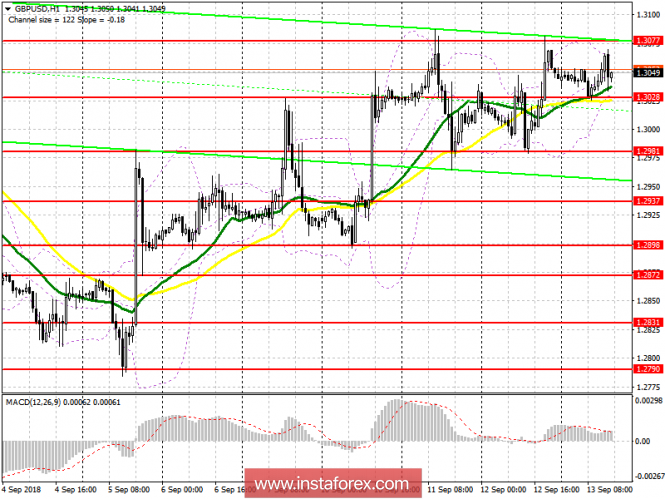
The 30-day moving average is on par with the 50-day moving average. This indicates that the trade will be conducted in the side channel.
Indicator description
- Moving Average (average sliding) 50 days - yellow
- Moving Average (average sliding) 30 days - green
- MACD: fast EMA 12, slow EMA 26, SMA 9
- Bollinger Bands 20