
To open long positions for GBP / USD pair, you need:
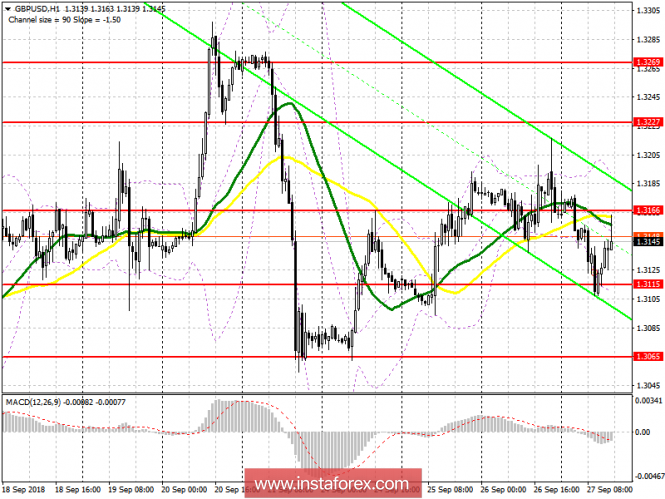
An unsuccessful attempt to grow the pound in the morning forms a new wave of decline. Under such a scenario, it is best to consider new long positions in the GBP/USD pair after updating the weekly low around 1.3065 or on a rebound from the new support area of 1.3015. The main task of buyers remains the return and consolidation at the resistance of 1.3166, above which demand for the British pound may return, that will lead to the tests of highs at 1.3227 and 1.3269.
To open short positions for GBP / USD pair, you need:
A repeat support test of 1.3115 may form a new major wave of the British pound's fall, which will lead to a minimum around 1.3065 and 1.3115, where fixing profits are recommended. In case the bears fail to break below 1.3115, returning to short positions in GBP / USD pair only after a false breakdown of 1.3166 or a rebound from the resistance of 1.3227.
Indicator signals:
Moving Averages
Trade moved below the moving average, and the 30-day average broke down from the top 50, which indicates the formation of a downward trend in the pound.
Bollinger Bands
The sharp increase in volatility of the downward movement indicates the presence of large sellers, which may lead to a further decrease in the pound, as long as the trade is below the mid-channel of the Bollinger bands.
Description of indicators
- MA (average sliding) 50 days - yellow
- MA (average sliding) 30 days - green
- MACD: fast EMA 12, slow EMA 26, SMA 9
- Bollinger Bands 20