
EUR/USD has broken above the neckline resistance of the inverted Head and Shoulders pattern and above the 1.1660 resistance trend line. Short-term trend is bullish. There are some warning divergence signs in the 4-hour chart but they could justify only a pullback towards 1.16.
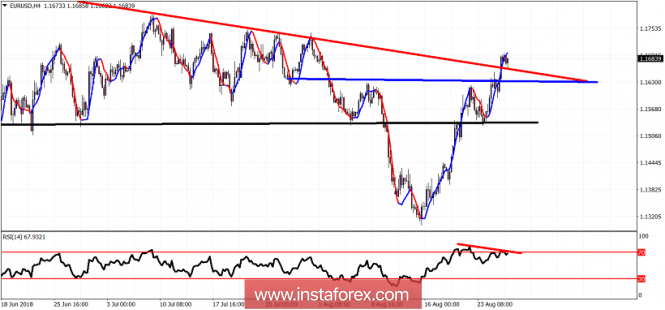
Blue line - neckline
Black line - support
Red line RSI- Bearish divergence
The EUR/USD pair has broken through both resistance levels (trend line and neckline). The EUR/USD pair could be forming a bigger reversal pattern as we might have seen the end of the decline from 1.24. If this is the case, the next deep pullback in EUR/USD should not break below the 1.13 low and form a higher low. We could see a push through 1.17-1.1750 before a deeper pullback towards 1.16. So far we only have some warning signs in the 4-hour chart but only for a short-term top and a pause to this new upward move. I prefer to be a buyer on pullbacks towards 1.16 than chase bullish positions at 1.17.
The material has been provided by InstaForex Company - www.instaforex.com