
The Gold price is making new 2018 lows. The price is visiting levels last seen in the summer of 2017. The long-term trend line support we showed yesterday has been broken for the time being. Only a weekly close above $1,240 would give Gold bulls hope of a reversal.
Blue lines - the bullish divergence remains
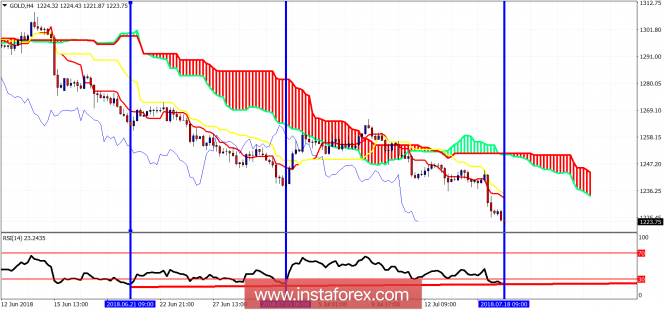
Red line - RSI support/bullish divergence
The Gold price broke below $1,237-35 support area and has visited $1,220 area as expected. Despite the new low the RSI did not make a new lower low. The RSI is at a higher level even since the low made on July 3rd near $1,236. Cloud resistance is found at $1,247 and bulls need to break this level to change short-term trend to bullish again. The RSI is also diverging on a daily basis and is very oversold on a weekly basis as well. This is not the time be chasing a short trade in Gold. At least a bounce towards $1,240-45 will come soon.
The material has been provided by InstaForex Company - www.instaforex.com