
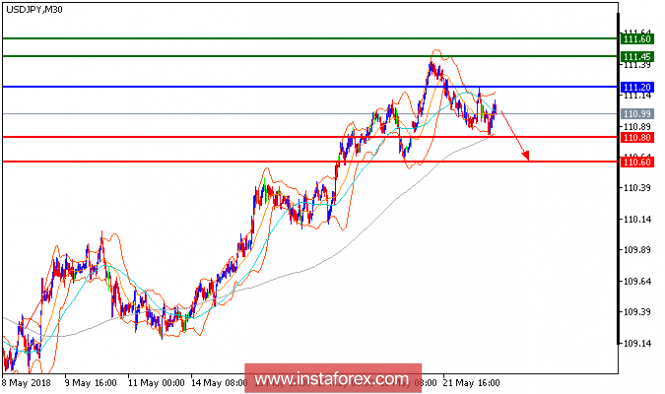
USD/JPY is under pressure. The continues its retreat from a high of 111.39 seen yesterday (May 21). Currently it remains capped by the descending 20-period moving average, which has just crossed below the 50-period one. The intraday configuration has turned bearish, and the pair is expected to test the support at 110.80 before declining further to 110.60.
Chart Explanation: The black line shows the pivot point. The present price above the pivot point indicates a bullish position, and the price below the pivot point indicates a short position. The red lines show the support levels, and the green line indicates the resistance levels. These levels can be used to enter and exit trades.
Strategy: SELL, stop loss at 111.20, take profit at 110.80.
Resistance levels: 111.45, 111.60, and 111.90
Support levels: 110.80, 110.60, and 110.30.
The material has been provided by InstaForex Company - www.instaforex.com