
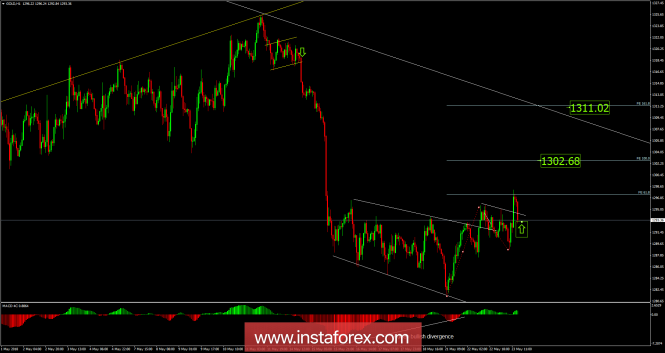
Recently, the Gold has been trading upwards. As I expected, the price tested the level of $1,298.00. According to the H1 time – frame, I found a broken ending diagonal in the background, which is a sign that buyers are in control. I also found a broken intraday bullish flag, which is another sign of strength. On the MACD oscillator, I found a hidden bullish divergence. My advice is to watch for potential buying opportunities. The upward targets are set at the price of $1,302.70 and at the price of $1,311.00.
Resistance levels:
R1: $1,293.00
R2: $1,294.00
R3: $1,296.00
Support levels:
S1: $1,289.50
S2: $1,288.40
S3: $1,286.60
Trading recommendations for today: watch for potential buying opportunities.
The material has been provided by InstaForex Company - www.instaforex.com