
The USD/CAD pair, although it has broken above the 4hour Ichimoku cloud, is trading on top of the resistance trend line and the price has not broken above the May 15th high yet, in order to start a new sequence of higher highs and higher lows. Therefore, there is still a chance that this bounce will reverse to the downside.
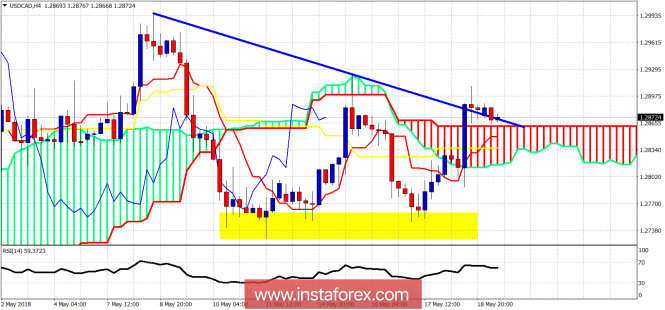
Blue line - trend line resistance
Yellow rectangle - support area
The USD/CAD pair has bounced strongly off the yellow support area and has broken above the 4 hour Ichimoku cloud. This is a bullish sign. If USD/CAD respects support at 1.2860, we could see another move higher towards 1.2950-1.30. If the price breaks below 1.2860-1.2830, we should expect another test of the yellow rectangle area. A break below the yellow support area will be a very bearish sign.
The material has been provided by InstaForex Company - www.instaforex.com