
Gold price is breaking down below the recent $1,285-$1,295 consolidation. Gold price could see $1,270-75, but the bearish divergence signs continue to warn us that the next big move will be to the upside. I'm a buyer of Gold at the current or lower levels.
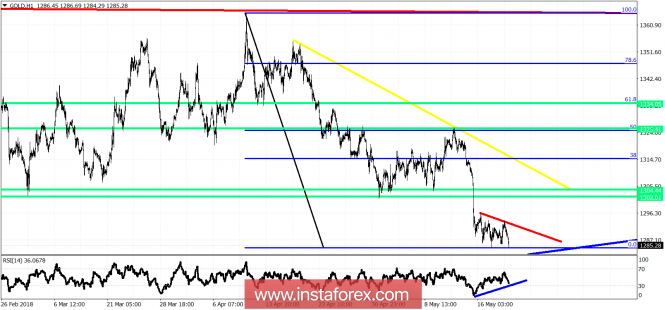
Blue lines - bullish divergence warning
Green lines - target levels
Yellow line - medium-term resistance
Red line - short-term resistance
Short-term resistance is at $1,292. I expect Gold price to soon break above it and move towards our first targets of $1,302-$1,304. Next important resistance is at $1,310-13 where I can see the next big trend test. With a break above this level, the price will move towards the 50% and 61.8% Fibonacci retracement. A weekly close above the 61.8% Fibonacci retracement will open the way for a bigger move towards $1,425. Gold is at its final stages of the move from the $1,365 level.
The material has been provided by InstaForex Company - www.instaforex.com