
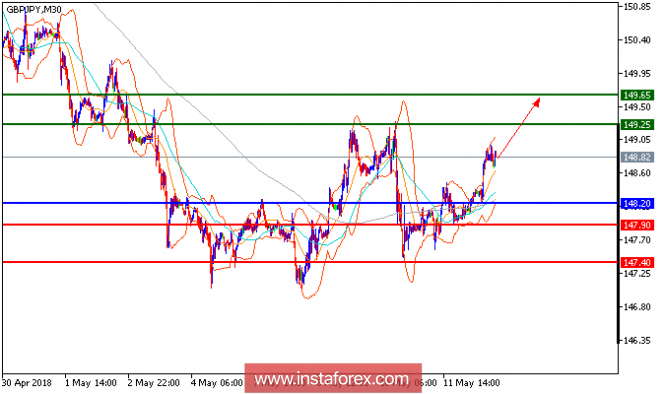
GBP/JPY is expected to trade with a bullish outlook and continue its rebound. The pair is edging higher and is challenging the key resistance at 149.25. Both rising 20-period and 50-period moving averages play support roles and maintain the upside bias. The relative strength index is bullish, calling for a further upside. To conclude, as long as 148.20 is not broken, look for a new advance with targets at 149.25 and 149.65 in extension.
Chart Explanation: The black line shows the pivot point. Currently, the price is above the pivot point which is a signal for long positions. If it remains below the pivot point, it will indicate short positions. The red lines show the support levels, while the green line indicates the resistance levels. These levels can be used to enter and exit trades.
Resistance levels: 149.25,149.65, and 150.20
Support levels: 147.90, 147.40, and 147.85
The material has been provided by InstaForex Company - www.instaforex.com