
Technical outlook:
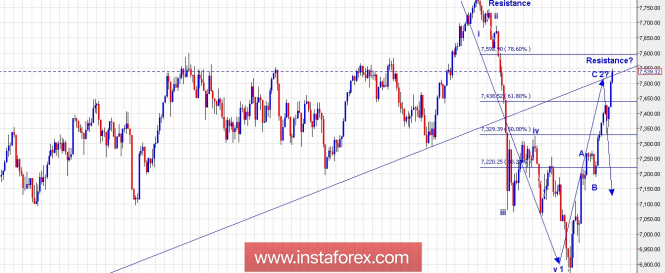
The daily chart for the FTSE, which is presented here, shows that the next bear leg is just about to begin. The FTSE dropped lower between January and March 2018, sub-dividing into 5 waves as labelled here. Also while dropping lower, it broke below its December 2016 trend line support as seen here. On March 26, 2018, wave 1 terminated and prices were clearly into the sell zone. The subsequent rally also unfolded into 3 waves labelled A-B-C here and the index is testing the back side of its support turned into resistance trend line low. Please also note that Fibonacci 0.618/0.786 resistances are also in play now and bears should ideally resume from current levels. A conventional Head and Shoulder reversal pattern is also been seen as the FTSE carves out its potential right shoulder now. A clear case of selling here should be kept in mind.
Trading plan:
Sell now around 7,540/7,500 levels, stop above 7,800, target is open.
Fundamental outlook:
Watch out for the German consumer Price Index and US PCE Core at 08:00 AM EST and 08:30 AM EST, respectively.
Good luck!The material has been provided by InstaForex Company - www.instaforex.com