
Technical outlook:
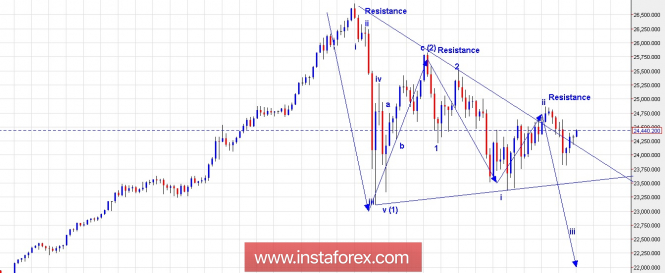
The Dow Jones daily chart has been presented here for a bigger picture of existing wave structure and it shows a potential cone type consolidation/contracting triangle since Jan 29, 2018; highs at 26,698 levels. If you observe closely, the pair has been carving out lower highs and lower lows. The index seems to be into its wave (3) of early stages at present. It the above structure holds true, then prices should stay below 24,869 levels and broadly below 25,750 levels. Having said that, please prepare to sell again around current levels at 24,400/500 with risk above immediate resistance at 24,860 levels. Please also note that a break below 23,500 levels will accelerate the drop and would extend through 20,000 levels in the weeks to come.
Trading plan:
Sell again around 24,400/500 levels stop around 25,000 target 20,000
Fundamental outlook:
Watch out for German consumer Price Index and US PCE Core at 08:00 AM EST and 08:30 AM EST, respectively.
Good luck!The material has been provided by InstaForex Company - www.instaforex.com