
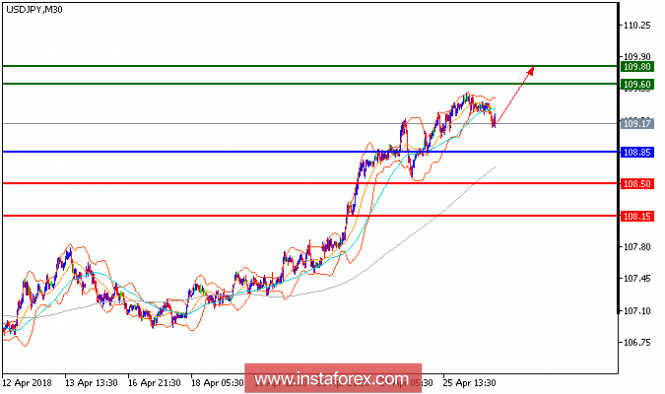
USD/JPY is expected to trade with bullish outlook. The pair is rebounding from 108.50 (the low of April 24) and is challenging both 20-period and 50-period moving averages. The relative strength index broke above the neutrality level at 50, calling for continuation of the bounce. Hence, as long as 108.85 is not broken, look for re-test of 109.60. A break above this level would trigger a new rise to 109.80.
Chart Explanation: The black line shows the pivot point. The present price above the pivot point indicates a bullish position, and the price below the pivot point indicates a short position. The red lines show the support levels, and the green line indicates the resistance levels. These levels can be used to enter and exit trades.
Strategy: BUY, stop loss at 108.85, take profit at 109.60.
Resistance levels: 109.60, 109.80, and 110.05
Support levels: 108.50, 108.15, and 107.50.
The material has been provided by InstaForex Company - www.instaforex.com