
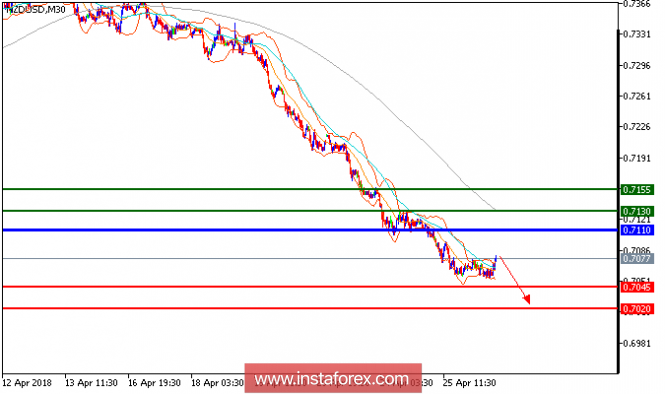
Our first downside target which we predicted in the previous analysis has been hit. NZD/USD is still expected to trade with bearish outlook. The pair remains in a downward trend, and is likely to post a new decline. The falling 50-period moving average acts as a resistance role. In addition, the relative strength index lacks upward momentum. To conclude, as long as 0.7110 is not surpassed, it's likely to advance to 0.7045 and 0.7020 in extension.
Chart Explanation: The black line shows the pivot point. Currently, the price is above the pivot point, which is a signal for long positions. If it remains below the pivot point, it will indicate short positions. The red lines show the support levels, while the green line indicates the resistance levels. These levels can be used to enter and exit trades.
Resistance levels: 0.7130, 0.7155, and 0.7185
Support levels: 0.7045, 0.7020, and 0.700.
The material has been provided by InstaForex Company - www.instaforex.com