
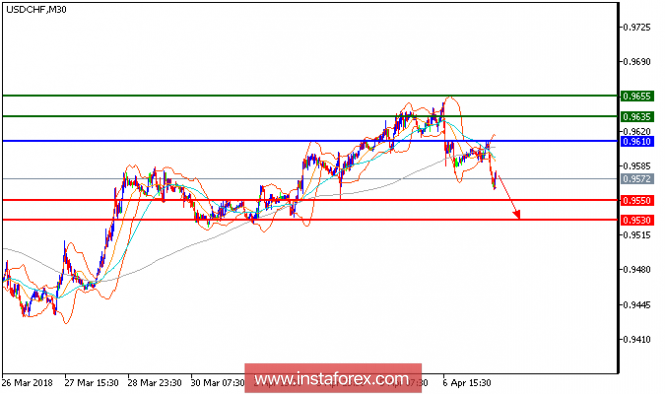
USD/CHF is expected to trade with a bearish outlook. The pair recently broke below its intraday rising trend line, which should confirm a bearish reversal. The 20-period moving average has reversed down, and also has crossed below the 50-period one (a negative signal). In addition, the relative strength index lacks upward momentum. Hence, as long as the resistance at 0.9610 is not surpassed, the risk of the break below 0.9550 remains high.
Chart Explanation: The black line shows the pivot point. The present price above the pivot point indicates a bullish position, and the price below the pivot point indicates a short position. The red lines show the support levels, and the green line indicates the resistance levels. These levels can be used to enter and exit trades.
Strategy: SELL, stop loss at 0.9610, take profit at 0.9550.
Resistance levels: 0.9635, 0.9655, and 0.9695
Support levels: 0.9550, 0.9530, and 0.9500.
The material has been provided by InstaForex Company - www.instaforex.com