
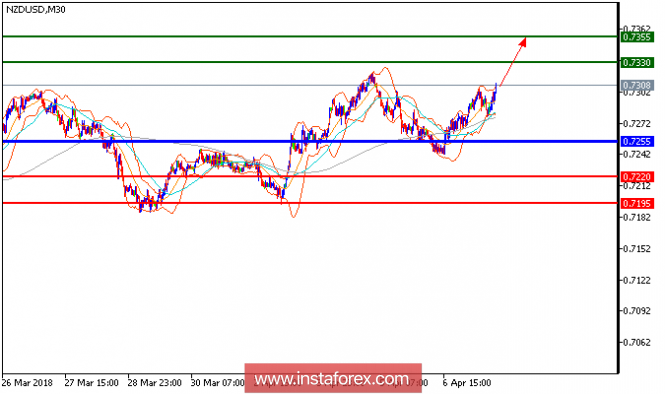
NZD/USD is expected to trade with a bullish outlook and continue its rebound. The pair has reversed up, and is expected to post a new rebound. A bullish cross has been identified between the 20-period and 50-period moving averages. Besides, the relative strength index is also positive above its neutrality area at 50. To conclude, as long as 0.7255 is not broken, likely advance to 0.7330 and 0.7355 in extension.
Chart Explanation: The black line shows the pivot point. Currently, the price is above the pivot point which is a signal for long positions. If it remains below the pivot point, it will indicate short positions. The red lines show the support levels, while the green line indicates the resistance levels. These levels can be used to enter and exit trades.
Resistance levels: 0.7330, 0.7355, and 0.7385.
Support levels: 0.7220, 0.7195, and 0.7145.
The material has been provided by InstaForex Company - www.instaforex.com