
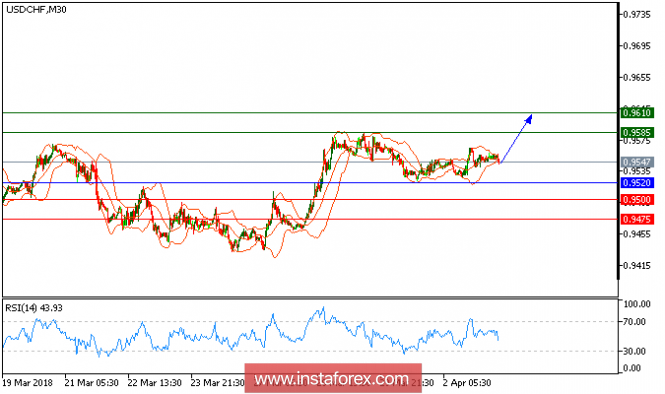
USD/CHF is expected to trade with a bullish outlook. The pair managed to hold above its key horizontal support at 0.9520, and is likely to post a new bounce. The 20-period moving average is turning up now and also crossed above the 50-period one (a bullish signal). In addition, the relative strength index is also positive above its neutrality area at 50. To sum up, as long as 0.9520 is not broken, likely advance to 0.9585 and 0.9610 in extension.
Chart Explanation: The black line shows the pivot point. The present price above the pivot point indicates a bullish position, and the price below the pivot point indicates a short position. The red lines show the support levels, and the green line indicates the resistance levels. These levels can be used to enter and exit trades.
Strategy: BUY, stop loss at 0.9520, take profit at 0.9585.
Resistance levels: 0.9580, 0.9610, and 0.9650
Support levels: 0.9500, 0.9475, and 0.9420.
The material has been provided by InstaForex Company - www.instaforex.com