
The Dollar index is getting rejected once again at the trend line resistance but still trades above the 4-hour cloud. The longer it takes to break above the 90.15 the more possible it is for prices to break down below the Ichimoku cloud once again.
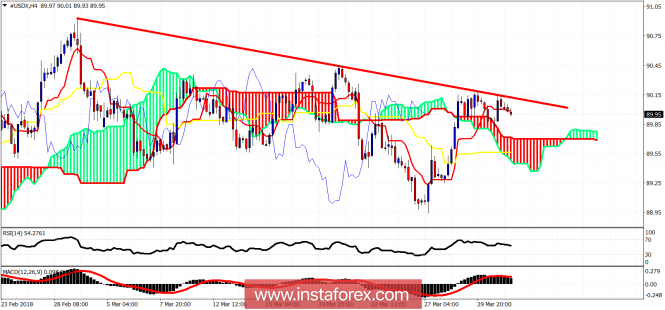
Red line - resistance
The Dollar index has short-term resistance at 90.15 where we see the red trend line resistance. Price has gotten rejected 4 times from that trend line. Support is in the cloud at 89.70. Break below the cloud support and we might see a deep pullback in the index that could even push the price below the March lows.
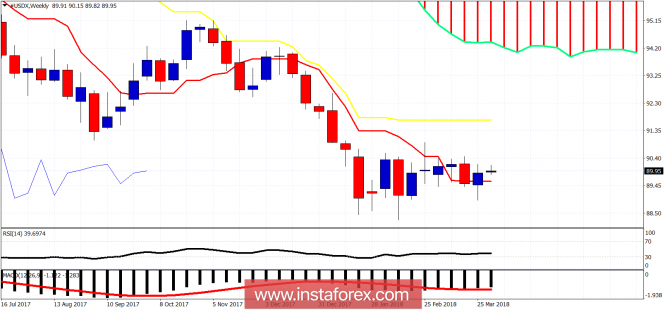
On a weekly basis, we remain above the tankan-sen indicator. Holding above the tankan-sen is a bullish sign. The Dollar index could very well push towards the weekly kijun-sen at 91.70. The first sign that we are heading towards that target is a break above 90.45. A weekly close below 89.50 will be a very bearish sign that would imply a new low below 88 might be coming.
The material has been provided by InstaForex Company - www.instaforex.com