
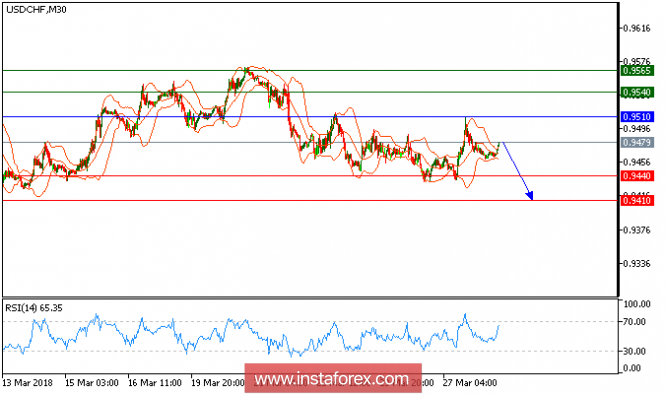
USD/CHF is under pressure and expected to remain below the key resistance at 0.9510. The pair is heading downward towards 0.9440, representing the intraday horizontal support. The relative strength index has broken below its neutrality area at 50, and is showing strong downward momentum. Hence, as long as 0.9510 holds on the upside, look for a new drop to 0.9440 and 0.9410 in extension.
Chart Explanation: The black line shows the pivot point. The present price above the pivot point indicates a bullish position, and the price below the pivot point indicates a short position. The red lines show the support levels, and the green line indicates the resistance levels. These levels can be used to enter and exit trades.
Strategy: SELL, stop loss at 0.510, take profit at 0.9440.
Resistance levels: 0.9515, 0.9540, and 0.9575
Support levels: 0.9420, 0.9400, and 0.9350.
The material has been provided by InstaForex Company - www.instaforex.com