MG Network

something big isHappening!

In the mean time you can connect with us with via:

Copyright © Money Grows Network | Theme By Gooyaabi Templates

Money Grows Network

Archive

Powered by Blogger.

Welcome To Money Grows Network

Verified By

2006 - 2019 © www.moneygrows.net

Investments in financial products are subject to market risk. Some financial products, such as currency exchange, are highly speculative and any investment should only be done with risk capital. Prices rise and fall and past performance is no assurance of future performance. This website is an information site only.

Popular

Pages

Expert In

Name*


Message*

Daily analysis of USDX for March 29, 2018

The index is having a bullish momentum and looks forward to breaking above the 200 SMA at the H1 chart, in an effort to reach the March 20th highs. However, the support zone of 89.36 could get broken and could allow additional losses to test the support level of 87.88. To the upside, a critical resistance is located at 90.63.

analytics5abbdb2c0796c.png

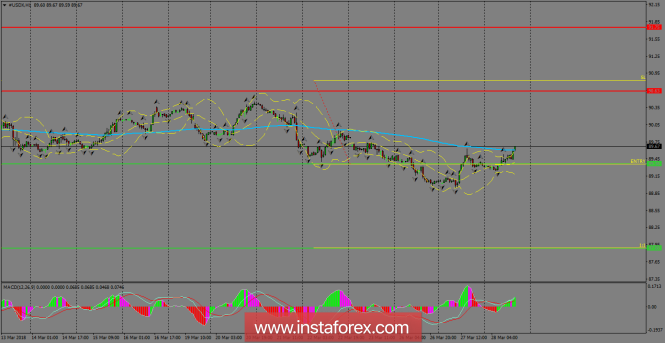
H1 chart's resistance levels: 90.63 / 91.75

H1 chart's support levels: 89.36 / 87.88

Trading recommendations for today: Based on the H1 chart, place sell (short) orders only if the USD Index breaks with a bearish candlestick; the support level is at 89.36, take profit is at 87.88 and stop loss is at 90.81.The material has been provided by InstaForex Company - www.instaforex.com