
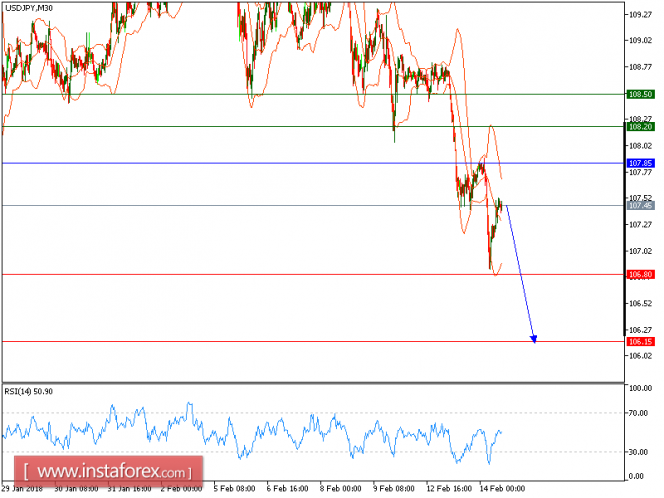
All our targets which we predicted in yesterday's analysis have been hit. The pair is rebounding from a low of 107.39 seen yesterday (February 13) but remains capped by the key resistance at 108.20. Though the relative strength index has climbed to the neutrality level at 50, showing a lack of downward momentum for the pair, intraday bearishness is still maintained by the descending 50-period moving average.
In case the current rebound loses steam failing to push the pair through the key resistance at 107.85, a return to 106.80 is expected.
Alternatively, if the price moves in the opposite direction, a long position is recommended to be above 107.85 with a target of 108.20.
Chart Explanation: The black line shows the pivot point. The current price above the pivot point indicates a bullish position, while the price below the pivot point is a signal for a short position. The red lines show the support levels, and the green line indicates the resistance level. These levels can be used to enter and exit trades.
Strategy: SELL, stop loss at 107.85, take profit at 106.80.
Resistance levels: 108.20, 108.5, and 108.85
Support levels: 10.30, 107.05, and 106.75.
The material has been provided by InstaForex Company - www.instaforex.com